

Open Interest vs. Volume in Options
Learn how options volume and open interest differ, how to read both together, and use them with price action to assess liquidity and sentiment.
When trading options, two key metrics help you understand market activity: volume and open interest. While both provide insights, they measure different things:
- Volume: Tracks the total number of contracts traded in a single day. It shows how actively a contract is being bought and sold.
- Open Interest: Measures the total number of active, unsettled contracts. It shows how many positions are still open.
Key differences:
- Volume resets daily; open interest is cumulative.
- Volume updates live during trading hours; open interest updates after the market closes.
- High volume shows active trading; high open interest indicates strong market participation.
When analyzed together, these metrics can reveal market trends and sentiment. For example:
- Rising prices with high volume and open interest suggest strong momentum.
- High volume but low open interest may indicate short-term speculation.
Use both metrics to avoid common mistakes, like assuming high volume always leads to high open interest or that open interest predicts price direction. Instead, focus on how these numbers interact with price movements to make better trading decisions.
What Are Open Interest and Volume?
What Is Open Interest?
Open interest reflects the total number of active options contracts that haven't been settled or closed. It increases when new buyer-seller pairs enter the market and decreases as positions are closed. However, if an existing trader transfers their position to another trader, open interest remains unchanged.
"Open interest (also known as open contracts or open commitments) refers to the total number of outstanding derivative contracts that have not been settled (offset by delivery)." – Wikipedia
Unlike volume, which updates continuously throughout the trading day, open interest is calculated once daily after the market closes. It starts at zero for every new options contract and represents the number of contracts held by either the buyer or the seller. This is because every long position is matched with a corresponding short position.
Now, let’s see how volume adds another layer of insight.
What Is Volume?
Volume measures the total number of options contracts traded during a specific period, typically within a single trading day. It includes every transaction, whether it’s opening or closing a position.
"Volume represents how often shares change hands between buyers and sellers." – Investopedia
Unlike open interest, volume resets daily, offering a real-time snapshot of market activity and demand. High volume often signals active trading, which can make it easier to execute trades and may result in tighter bid-ask spreads. Interestingly, daily volume can exceed open interest, especially when the same contracts are traded multiple times in a day without creating new positions.
Understanding these differences helps clarify how these metrics complement each other in trading strategies.
sbb-itb-a9ac3c2
How Open Interest and Volume Differ
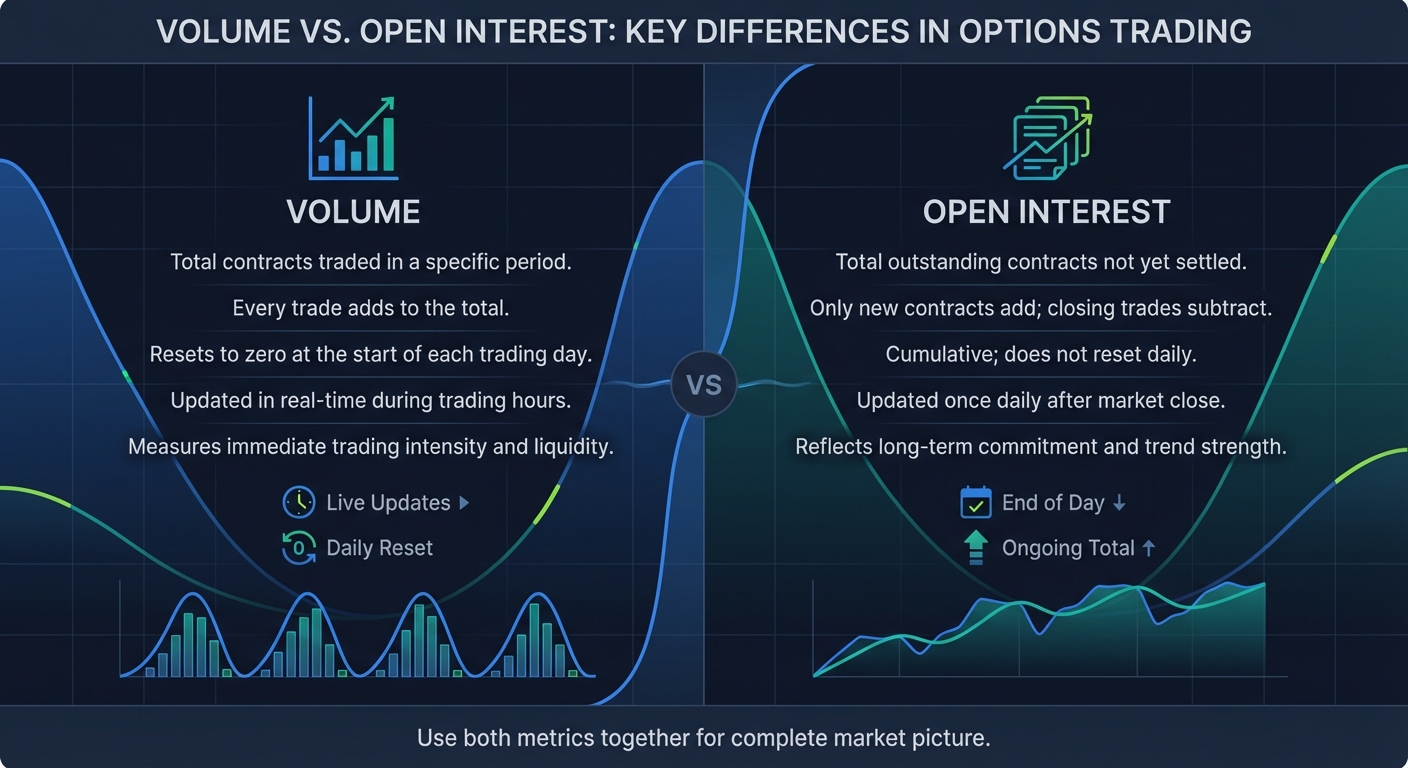
Open Interest vs Volume in Options Trading: Key Differences
While both open interest and volume measure aspects of options trading, they focus on entirely different elements of market activity. Volume tracks the total number of transactions during a trading day, counting every trade - whether it's opening or closing a position. It provides a real-time snapshot of daily trading activity. On the other hand, open interest reflects the total number of active, unsettled contracts at the end of the trading session, offering insight into market participation over time.
One key distinction lies in how these metrics update. Volume is updated live throughout the trading day, giving traders immediate feedback on activity. Open interest, however, is updated after market close by the Options Clearing Corporation (OCC), meaning the data you see reflects the previous trading day's activity.
Another difference is how each metric resets. Volume starts fresh every trading day, capturing only that day's trades. Open interest, in contrast, is cumulative. It changes only when new contracts are created or existing ones are closed. For example, if a single contract is traded multiple times in a day, it repeatedly adds to volume but only counts once toward open interest.
Comparison Table: Open Interest vs. Volume
| Feature | Volume | Open Interest |
|---|---|---|
| Definition | Total contracts traded in a specific period. | Total outstanding contracts not yet settled. |
| Calculation | Every trade adds to the total. | Only new contracts add; closing trades subtract. |
| Reset Frequency | Resets to zero at the start of each trading day. | Cumulative; does not reset daily. |
| Update Timing | Updated in real time during trading hours. | Updated once daily after market close. |
| Primary Purpose | Measures immediate trading intensity and liquidity. | Reflects long-term commitment and trend strength. |
These distinctions highlight how each metric serves a unique purpose, helping traders interpret market dynamics more effectively.
How Open Interest and Volume Work Together
Although they measure different aspects of trading, open interest and volume complement each other to provide a broader view of market conditions. Volume reveals the intensity of current trading activity and liquidity, making it easier to gauge how quickly positions can be entered or exited. Open interest, meanwhile, reflects the level of market engagement, showing how much capital remains tied up in existing positions and whether traders are building new positions or unwinding old ones.
When both volume and open interest are high, markets are typically more liquid, often leading to tighter bid-ask spreads. However, mismatches between the two can offer valuable clues. For instance, if volume far exceeds open interest, it might indicate a surge in short-term speculative trading, as contracts are repeatedly traded within the same day. On the flip side, high open interest with low volume could suggest that traders are holding their positions, often during periods of market consolidation.
"High open interest for a given option contract means a lot of people are interested in that option... the main benefit is that it tends to reflect greater liquidity for that contract." – The Options Playbook
How to Use Open Interest and Volume in Trading
Using Open Interest to Assess Market Sentiment
Open interest reflects the level of market activity and participation. When prices climb alongside rising open interest, it indicates increasing trader commitment, reinforcing the strength of the trend. On the other hand, if prices rise but open interest declines, it often points to short covering, suggesting the rally might lack genuine strength.
Clusters of open interest at specific strike prices can reveal key resistance and support levels. For example, "call walls" at higher strikes and "put walls" at lower strikes often act as barriers. Market makers, who hedge these positions by trading the underlying stock, can pin prices near these levels. These clusters are frequently found at round numbers like $100 or $150.
The Put/Call Open Interest Ratio offers another way to gauge sentiment. A ratio above 1 generally signals bearish sentiment (more puts than calls), while a ratio below 1 suggests bullish sentiment. Extreme values can even act as contrarian indicators - an unusually high ratio might signal an oversold market primed for a rebound.
Volume analysis complements open interest, helping confirm whether these signals carry real momentum.
Using Volume to Confirm Price Movements
Volume acts as a barometer for the strength of price moves. A price increase accompanied by high volume suggests strong conviction, as substantial capital supports the move. Conversely, price changes on low volume often lack follow-through and may reverse.
Take, for example, April 2021, before Apple's "Spring Loaded" event. Traders observed a significant spike in both call option volume and open interest for AAPL. This surge indicated that new positions were being established ahead of anticipated product announcements. When Apple unveiled new iPads and iMacs, the stock price rose, rewarding those who used these metrics to confirm a bullish outlook.
To avoid illiquid setups, professional traders often focus on options with at least 5,000 open interest and daily volume exceeding 500. These thresholds ensure sufficient liquidity for entering and exiting trades efficiently.
Combining Both Metrics for Better Decisions
While open interest and volume each provide valuable insights, analyzing them together with an options strategy planner offers a more complete picture. Divergences between the two can reveal market weaknesses or shifts. For instance, in late 2022, ahead of Meta Platforms' Q4 earnings report, high put volume coincided with falling open interest. This combination showed that traders were closing existing positions rather than initiating new bearish bets. As a result, despite the high put volume, the falling open interest signaled weak negative conviction. Meta's stock later surged after the earnings report and a $40 billion buyback announcement.
| Price Action | Volume | Open Interest | Market Interpretation |
|---|---|---|---|
| Rising | High | Rising | Strong bullish trend (new money entering) |
| Rising | Low | Falling | Weak rally (short covering/money leaving) |
| Falling | High | Rising | Strong bearish trend (new short positions) |
| Falling | High | Falling | Selling climax/liquidation (possible rebound) |
"Open interest tells me whether I'll be able to get in and out without giving up edge. Volume tells me if there's any heat on the strike right now." – Andy Crowder, The Option Premium
In practice, use volume to measure immediate market activity and open interest to assess whether the moves represent sustained capital or just short-term noise.
Common Mistakes About Open Interest and Volume
Mistake: High Volume Always Means High Open Interest
One of the most frequent misunderstandings among traders is believing that high trading volume automatically leads to high open interest. These two metrics measure different things. Volume reflects the total number of contracts traded in a session, while open interest accounts only for contracts that remain active and unsettled at the end of the trading day.
For instance, a single contract might change hands multiple times in one day, inflating the volume without altering open interest. To illustrate, a trading session might record 10,000 contracts in volume, yet the open interest could remain at just 5,000.
"Volume can be higher than open interest... because contracts can trade hands multiple times without creating a new contract." – Option Alpha
High volume can also result from traders closing their positions. In such cases, the volume increases, but open interest may decrease. For example, when a seller closes an existing contract and sells it to a buyer opening a new position, the transaction adds to the volume but leaves the total open interest unchanged. If volume far exceeds open interest, it often signals speculative activity, where day traders are rapidly buying and selling a limited number of contracts rather than building long-term positions.
"High volume can be caused by liquidation instead of new interest, possibly leading to false signals and a misinterpretation of market sentiment." – Tyler Corvin, Senior Trader, The Trading Analyst
This disconnect between volume and open interest is why traders should never rely on volume alone to gauge market conditions. Both metrics must be analyzed together to avoid drawing inaccurate conclusions.
Mistake: Open Interest Predicts Price Direction
Another common error is assuming that open interest can predict future price movements. In reality, open interest measures market activity and participation, not price direction.
High open interest simply means a large number of contracts are active. While a surge in call option open interest might suggest optimism and higher put option open interest could indicate caution, these signals don't guarantee where prices are headed. Open interest should always be evaluated alongside price action and volume to determine whether a trend is strengthening or weakening.
"A common misconception about open interest lies in its ability to make predictions. New traders might be led to believe that it can forecast price action, but it cannot." – Investopedia
Although high open interest often helps assess liquidity and narrows bid-ask spreads, it doesn't ensure profitability. In fact, liquid contracts can attract more competition, which may reduce potential profit margins.
To interpret open interest effectively, consider the broader market context. For example, rising open interest during a price decline could signal new short positions, which is typically bearish. Conversely, increasing open interest during a rally might indicate new long positions, a bullish sign. It's also important to remember that open interest naturally decreases as contracts approach expiration. This decline is normal and shouldn't be confused with a lack of market interest.
Conclusion
Volume measures the daily trading activity, while open interest reflects the level of ongoing market participation. Together, these metrics provide a clearer picture of market dynamics. Volume gives a snapshot of real-time activity but doesn’t distinguish between new trades and the unwinding of existing positions. Open interest, on the other hand, shows whether traders are opening new positions or closing old ones. When both volume and open interest increase alongside price movement, it often points to a strong and sustained trend.
"Open interest and volume are the energy that powers the machinery in the option market." – WarsOption
To ensure effective trading, check that the options you're considering have sufficient liquidity. Look for contracts with a daily volume of at least 500 and an open interest exceeding 5,000. This reduces the risk of dealing with thinly traded contracts, which can lead to wider bid-ask spreads and slower order execution. Also, pay attention to situations where volume far exceeds open interest, as this can indicate short-term speculation or significant shifts in institutional activity.
FAQs
Why can options volume be higher than open interest?
Options volume can surpass open interest because volume measures all trades executed within a single trading session. This includes both newly created contracts and those being closed out. On the other hand, open interest reflects only the total number of active contracts that remain open. It increases when new contracts are created and decreases when contracts are closed. As a result, even during periods of heavy trading, open interest might not change much, while volume can spike significantly.
How do open interest changes indicate opening vs. closing trades?
Changes in open interest provide insight into trading activity. When open interest increases, it means new contracts are being created, signaling opening trades. On the other hand, a decrease in open interest occurs when contracts are sold, exercised, or expire, indicating closing trades. These shifts help traders gauge market participation and sentiment effectively.
What’s a “call wall” or “put wall,” and why does it matter?
A "call wall" refers to a substantial accumulation of call options at a particular strike price, which often serves as a resistance level. On the flip side, a "put wall" is a notable concentration of put options at a specific strike price, acting as support. These levels can shape price movements because market makers adjust their hedges, potentially leading to reversals or breakouts, especially around options expiration. Understanding these dynamics can help traders make more informed decisions.