

Dynamic Position Sizing in Volatile Markets
Adjust trade sizes to market volatility so each trade carries consistent dollar risk and portfolio exposure stays protected.
Markets change constantly, and so should your risk management. Dynamic position sizing adjusts your trade size based on market volatility, ensuring consistent risk regardless of conditions. Unlike fixed sizing, this approach reduces exposure during volatile periods and allows for increased positions when the market stabilizes.
Key Takeaways:
- Why it matters: Fixed position sizing ignores market fluctuations, exposing you to uneven risks. Dynamic sizing ensures every trade carries the same dollar risk.
-
How it works: Use volatility metrics like the VIX and ATR to calculate position sizes. For example:
- If ATR doubles, your position size halves to maintain consistent risk.
- Adjust risk per trade based on VIX levels (e.g., scale down above 30).
- Results: A NASDAQ breakout strategy (2012–2024) showed nearly double the profit with dynamic sizing compared to fixed sizing.
Tools and Formulas:
- ATR Formula: Position Size = Account Risk ÷ (ATR × Multiplier)
- VIX Adjustment: Adjust Risk = Base Risk × (Baseline VIX ÷ Current VIX)
Dynamic sizing isn’t about betting big - it’s about protecting your capital and staying consistent, no matter how the market moves.
Tools for Measuring Volatility
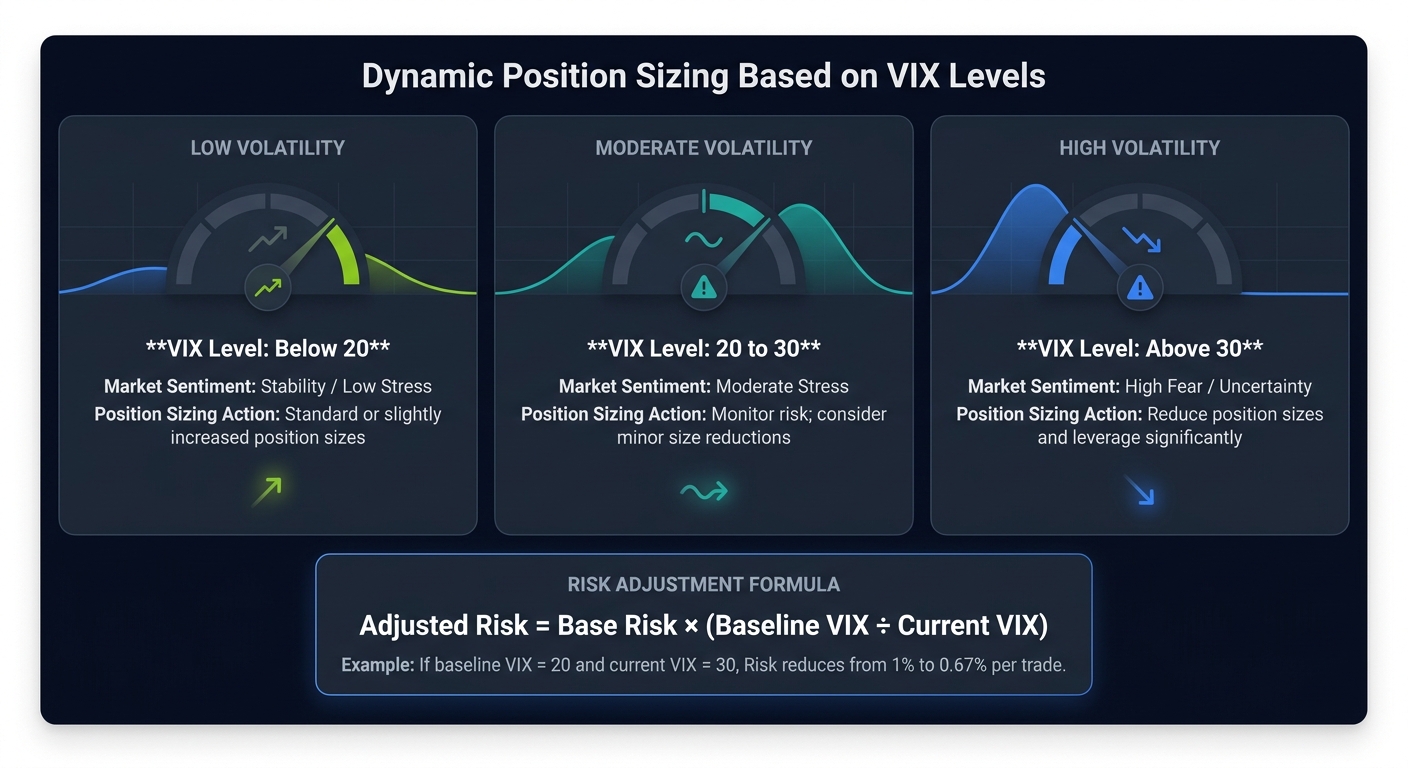
VIX-Based Position Sizing Guide: Market Conditions and Risk Adjustments
Getting position sizing right starts with understanding volatility. To do that effectively, you’ll need tools that measure both market-wide trends and individual asset movements. Two key metrics stand out: the VIX and the Average True Range (ATR). The VIX tracks overall market sentiment, while ATR zeroes in on specific assets. Together, they give you a more complete view of the risk landscape.
Using the VIX to Gauge Market Volatility
The CBOE Volatility Index, or VIX, reveals the market's expectations for the next 30 days of volatility in the S&P 500. It’s calculated using the implied volatilities of S&P 500 options, making it a forward-looking measure of investor sentiment. When fear spikes, so does the VIX; when the markets settle, the VIX drops.
"The CBOE Volatility Index (VIX), also known as the Fear Index, measures expected market volatility using a portfolio of options on the S&P 500." - Investopedia
On average, the VIX hovers around 21. A reading below 20 suggests calm, while anything above 30 signals heightened uncertainty and fear. For example, in March 2026, the VIX climbed to a monthly average of 25.6%, a 6.5-point jump from the previous month. During this period, options trading surged, with average daily volumes hitting 66.3 million contracts as traders sought protection.
The VIX is also a handy tool for adjusting your risk. When it rises, you scale back positions; when it drops, you can afford to take on more exposure. You can use this formula to adjust risk:
Adjusted Risk = Base Risk × (Baseline VIX / Current VIX).
For instance, if your baseline VIX is 20 and it jumps to 30, you’d reduce your risk per trade from 1% to 0.67%. This adjustment helps keep your dollar risk consistent, no matter how volatile the market becomes.
| VIX Level | Market Sentiment | Position Sizing Action |
|---|---|---|
| Below 20 | Stability / Low Stress | Standard or slightly increased position sizes |
| 20 to 30 | Moderate Stress | Monitor risk; consider minor size reductions |
| Above 30 | High Fear / Uncertainty | Reduce position sizes and leverage significantly |
Once you’ve accounted for market-wide volatility, you can turn to ATR to fine-tune your approach for individual assets.
Calculating ATR for Individual Stocks
While the VIX gives you the big picture, ATR focuses on the volatility of a single asset. It’s a backward-looking measure that shows how much a stock typically moves over a set period.
To calculate ATR, start with the True Range (TR) for each period. The TR is the largest of these three values:
- The difference between the current high and low
- The absolute value of the difference between the current high and the previous close
- The absolute value of the difference between the current low and the previous close
Once you’ve calculated TR for several periods, you average them - typically over 14 periods - to get the ATR.
"ATR sizing provides more consistent risk exposure across different market conditions. In a high-volatility market with an ATR of $4, ATR sizing might result in a position of 125 shares, while in a low-volatility market with an ATR of $1, it might allow for 500 shares." - Alex Pierrefeu, CPO & Co-founder, LuxAlgo
You can use ATR to calculate position size with this formula:
Position Size (Units) = Account Risk Dollars / (ATR Value × ATR Multiplier).
The multiplier, which typically ranges from 1.5× to 3.0×, adjusts your trade’s buffer. A smaller multiplier (e.g., 1.5×) works well for tight stops in trend-following strategies, while a larger one (e.g., 3.0×) is better for volatile breakout trades.
Here’s an example: If you’re risking $1,000 on a trade and the ATR is $2.50 with a 2× multiplier, your position size would be:
$1,000 / ($2.50 × 2) = 200 shares.
If the ATR later spikes to $5.00 due to earnings or market news, the same formula would reduce your position size to 100 shares, keeping your dollar risk consistent.
Choose your ATR lookback period based on your trading style.
- For aggressive day trading, use 5- or 7-period ATR.
- For swing trading, stick with 14 periods.
- For long-term trend following, opt for 20- or 50-period ATR.
This approach ensures that your position sizes stay aligned with changing volatility, whether you’re trading in calm or turbulent markets.
sbb-itb-a9ac3c2
How to Adjust Position Sizes Based on Volatility
Adjusting position sizes based on volatility helps ensure that the dollar risk you take on each trade remains consistent, no matter how much the market moves. By using tools like the VIX and Average True Range (ATR), you can adapt your trade sizes to reflect current market conditions. When volatility spikes, you scale down your positions. Conversely, when markets are calm, you can safely increase your exposure without taking on additional risk.
The Position Sizing Formula
The formula for determining position size in volatile markets is straightforward:
Position Size (Units) = (Account Equity × Risk %) / (ATR × Multiplier).
This calculation ensures that your dollar risk per trade remains steady, regardless of how much an asset fluctuates.
Here’s an example:
- With a $100,000 account and a risk limit of 1% ($1,000), if a stock’s ATR is $2.00 and you use a 2.5× multiplier (setting a $5.00 stop), your position size would be 200 shares ($1,000 ÷ $5.00).
- If the ATR later rises to $3.50 and you adjust your multiplier to 3.0× for more flexibility, your stop distance increases to $10.50. In this case, your position size drops to 95 shares.
"Using ATR to adjust position size transforms risk management from a static discipline into a dynamic, adaptive system." - QuantStrategy.io Team
The ATR multiplier typically ranges between 2.0× and 3.0×. A tighter multiplier (e.g., 1.5×) is suitable for stable markets, while a wider one (e.g., 3.0×) provides extra room during volatile periods, such as earnings announcements or market breakouts.
| ATR Value | Multiplier | Stop Distance | Position Size (Units) | Market Condition |
|---|---|---|---|---|
| $1.20 | 2.0 | $2.40 | 417 | Low volatility (larger size possible) |
| $2.00 | 2.5 | $5.00 | 200 | Moderate volatility |
| $3.50 | 3.0 | $10.50 | 95 | High volatility (smaller size needed) |
Example based on a $1,000 risk amount [11]
You can adjust this calculation to match changing market conditions.
Reducing Position Sizes When Volatility Spikes
When volatility increases, the ATR rises, and your position size should shrink to maintain consistent dollar risk. Failing to adjust could lead to outsized losses if a stock moves aggressively through your stop level.
In extreme conditions, you might also lower your risk percentage from the standard 1–2% to 0.5–1%. Another option is to widen your ATR multiplier to 3.0× or more, helping you avoid premature stop-outs caused by normal market fluctuations. These adjustments naturally result in smaller position sizes. For instance, if the ATR jumps from $2.00 to $5.00, your position size would drop from 250 shares to 100 shares if you’re risking $1,000 with a 2.0× multiplier.
Another important safeguard is to limit your total portfolio heat - the combined risk across all open trades. You can monitor these metrics using portfolio intelligence tools to maintain clarity on your exposure. A common rule is to cap this at 5% of your account. Additionally, consider setting a daily stop-loss limit (e.g., 2% of your account) to prevent a single bad day from causing excessive damage. These measures help protect you from sector-wide selloffs or correlated volatility spikes.
Increasing Position Sizes in Calm Markets
When volatility decreases, the ATR shrinks, allowing for larger positions while keeping your dollar risk constant. This creates an opportunity to increase exposure without taking on additional risk.
In calm markets where the ATR is less than 1% of the asset’s price, you might even consider using higher leverage - up to 10:1 - compared to volatile periods where leverage should be minimized. For example, with an ATR of $1.00 and a 3.0× multiplier, your stop distance is $3.00. If you’re risking $500, you could take 166 shares. If the ATR drops to $0.50, that same $500 risk allows for 333 shares, effectively doubling your position size without increasing your risk.
To stay aligned with market conditions, it’s essential to recalculate the ATR and your position size before each trade. Markets can shift rapidly, and yesterday’s calm might turn into today’s volatility. By recalculating regularly, you ensure your strategy adapts to these changes.
Managing Portfolio Risk and Exposure
Once you've fine-tuned individual trades with dynamic position sizing, it's time to address the bigger picture - your portfolio's overall risk. Even if each trade is optimized, failing to manage cumulative exposure can lead to outsized losses. The key is to strike a balance: protect your account from compounding mistakes during volatile periods while leaving enough room to seize new opportunities.
Defining Your Risk Per Trade
Most professional traders stick to risking 0.5%–2% of their account per trade, a range that balances stability at the portfolio level with flexibility for individual trades. This isn’t a one-size-fits-all rule, though. Your exact percentage should shift based on market conditions and your confidence in a given setup.
For instance, during periods of high volatility or when the VIX is elevated, it’s wise to scale back risk to 0.5–1% per trade. Price movements are harder to predict in such environments, and wider stop-loss levels can result in larger-than-expected drawdowns. On the other hand, in calmer markets with low Average True Range (ATR) readings, you might increase risk toward the 2% mark - especially for setups you’ve thoroughly tested and trust.
Your mental state is another critical factor. If you’re feeling stressed, fatigued, or recovering from recent losses, it’s smart to lower your risk percentage until you’re back on track. One helpful technique is the pre-trade mental reset: before executing a trade, mentally accept the possibility of losing the capital at risk. This mindset reduces emotional attachment and makes it easier to stick to your plan if the market turns against you.
By balancing trade-specific risk with broader portfolio safeguards, you can maintain disciplined risk management no matter the market conditions. Next, let’s explore how portfolio-level measures can further protect against cumulative losses.
Limiting Losses with Position Caps
Managing risk doesn’t stop at the trade level. Portfolio-wide limits are essential for preventing large drawdowns, especially during losing streaks or market-wide downturns. One effective method is a three-tiered drawdown protocol, which reduces exposure as your account declines from its peak:
| Drawdown Level | Action Required | Trading Restrictions |
|---|---|---|
| Down 5% | Reduce per-trade risk by 25% | Continue trading all setups |
| Down 10–15% | Reduce per-trade risk by 50% | Focus only on high-conviction "A-setups" |
| Down >15% | Pause all trading for 24–72 hours | Review trading journals and reset emotionally |
"Without a throttle you compound error. Fix: implement percentage-based cutbacks and halts and only restore size after recovery."
- Jasman Mann, International Trading Institute
Institutional strategies often recommend cutting risk by 25–50% once your portfolio suffers a 10–15% drawdown. These measures act as guardrails, ensuring that a bad streak doesn’t spiral into catastrophic losses.
Another important consideration is avoiding over-concentration in correlated assets. For example, holding multiple tech stocks that tend to move in tandem might give the illusion of diversification, but it amplifies your risk instead. Setting a cap on how much of your total Value at Risk (VAR) can be allocated to a single sector helps mitigate this issue. Similarly, dynamic leverage adjustments can play a role: if ATR exceeds 3% of an asset’s price, reduce leverage to 1:1 or avoid it altogether.
The most effective safeguards are those that trigger automatically. By removing the temptation to make decisions in the heat of the moment, these rules help you stay disciplined and ready to trade when the next opportunity arises.
Tracking and Improving Your Position Sizing
Adjusting to market volatility means keeping a close eye on your position sizing decisions. This isn't something you can set and forget. To know if your strategy is on track, you need to log every decision and analyze the results. Without a detailed record, it’s tough to tell whether your outcomes are based on skill or just luck - and even harder to spot patterns that might be hurting your account. This tracking process forms the backbone for the techniques discussed next.
How to Journal Your Position Sizing Decisions
When journaling, make sure to document both the technical details and your thought process. For each position size, note the logic behind your decision. Did you use a 2.5× ATR multiplier? A 1% fixed-risk rule? Or did you size up because you had high conviction in a particular setup? Write it all down.
Include the market context as well. Record metrics like the 14-period ATR, the VIX level, and overall market conditions. Don’t overlook your emotional state - this can reveal patterns you might not otherwise notice. Rate your conviction for each trade (high, medium, or low), and later compare these ratings with the results. This can help you determine whether your "high conviction" trades are genuinely better or if overconfidence is skewing your performance.
Another helpful mindset is the “mental trash bin” approach: treat the capital you’re risking as already lost. Documenting this mindset can reduce emotional attachment if the market moves against you.
Using Trade Data to Improve Your Strategy
Once you’ve built a thorough journal, use the data to refine your approach. Compare your results with dynamic sizing against a fixed-size strategy. This can help you see if you’re taking on too much risk during volatile periods or missing out on gains during calmer markets. Research highlights how static sizing can lead to a 5.6× difference in actual account risk between turbulent times like March 2020 and quieter stretches like July 2021.
Pay special attention to your ATR multipliers. If you’re getting stopped out too often, your multiplier - say, 2.0× ATR - might be too tight. On the other hand, if you’re facing large drawdowns, it could be too wide, forcing you to shrink your position sizes unnecessarily. Backtest these parameters across different market conditions, from crises to quiet periods, to ensure your strategy balances profitability with stability.
"Trading is about protecting your capital, not chasing profits. Making money in the market is relatively easy; preserving it is the hard part." - StockioAI Team
Lastly, set firm boundaries to keep your adjustments disciplined. For example, stick to a strict 1% risk per trade. Rules like limiting sector exposure to 20% can prevent impulsive decisions from turning into reckless gambling. By regularly comparing your actions to these predefined rules, you can quickly spot when emotions are driving your choices instead of data.
Using ThetaEdge for Position Sizing and Risk Analysis
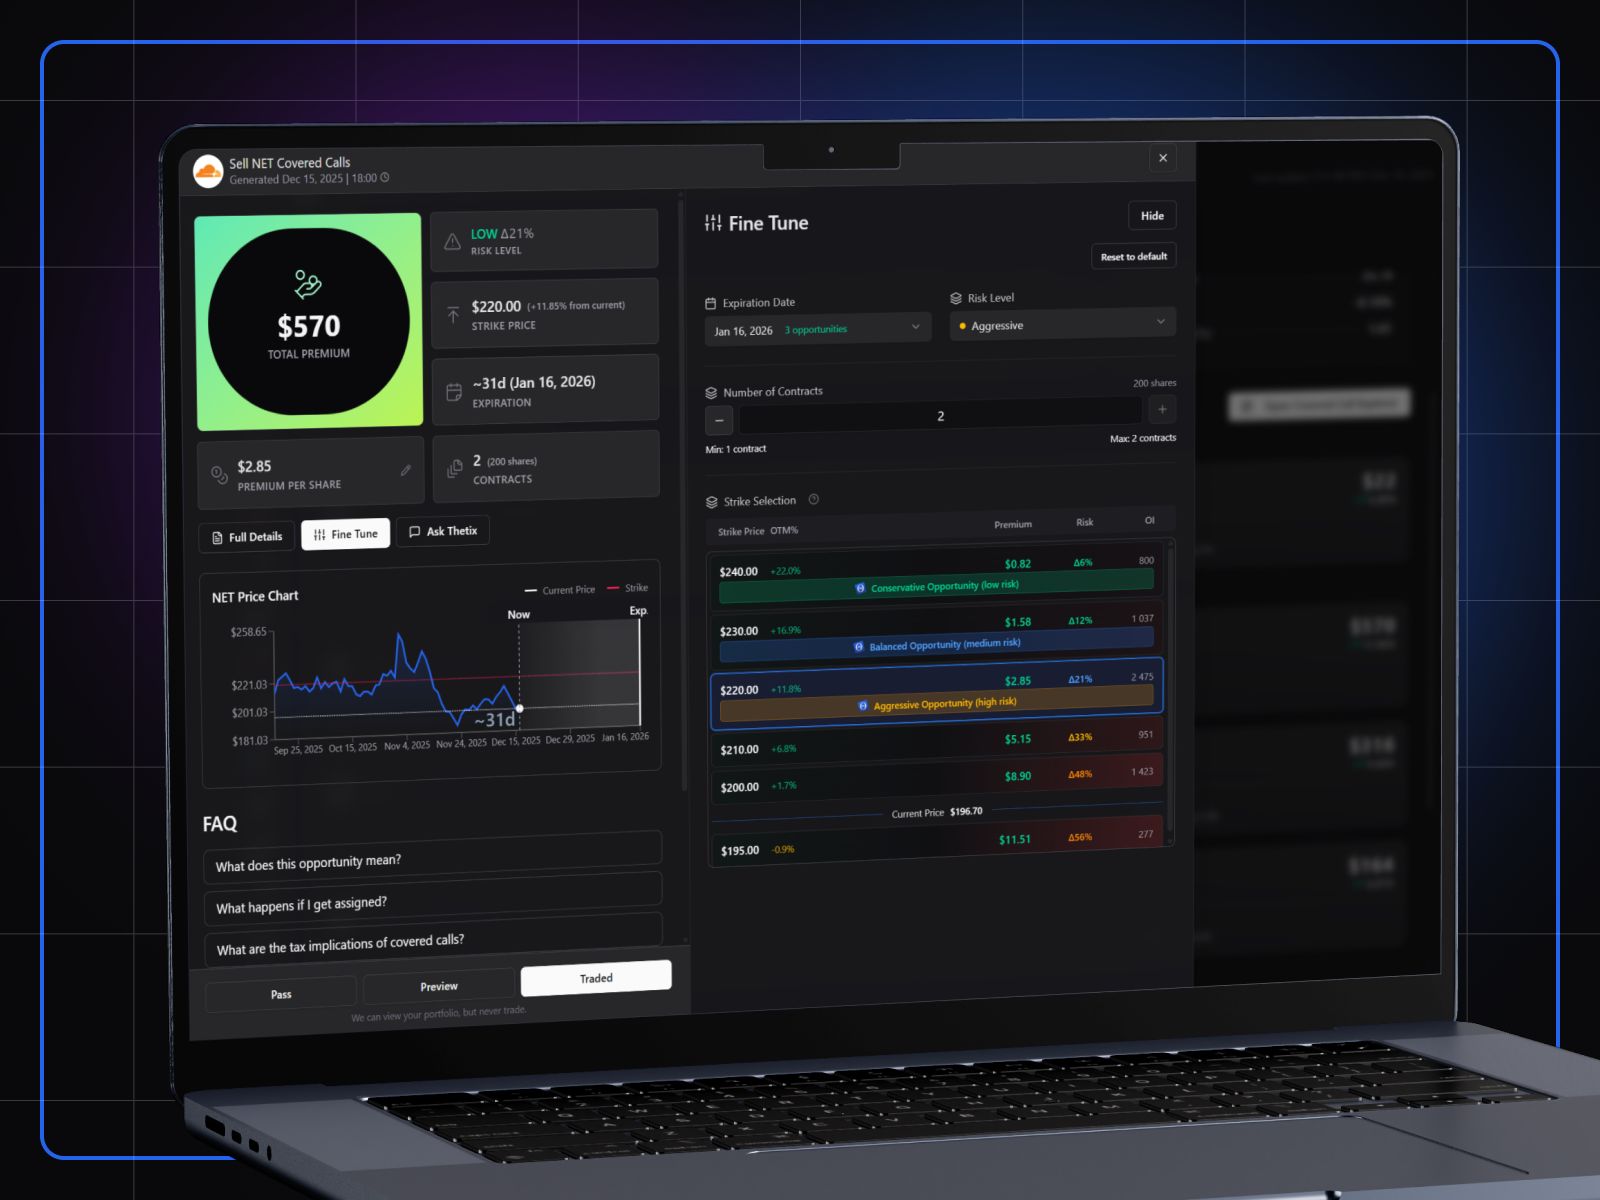
Refine your position sizing strategy by incorporating advanced analytics. With tools like ThetaEdge, you can integrate your actual holdings into a dynamic risk analysis framework. By connecting to over 80 brokerages, ThetaEdge pulls in your portfolio data, allowing you to assess how each new trade impacts your overall exposure. This approach ensures you're not sizing positions in isolation but instead maintaining balanced sector exposure and consistent dollar risk per trade.
Portfolio-Aware Opportunity Analysis
ThetaEdge takes a portfolio-first approach, unlike generic screeners that treat all tickers equally. It evaluates opportunities - such as covered calls vs cash-secured puts and multi-leg spreads - based on your existing holdings and risk profile. For instance, if your portfolio is already heavily weighted in a particular sector and market volatility spikes, the platform can alert you to the potential imbalance that adding another position might create.
You can also choose from three risk profiles. For example, in a conservative mode during periods of high volatility, you might aim for an assignment probability of around 15% to safeguard your current share positions.
Risk Metrics and Trade-Off Analysis
ThetaEdge provides critical risk metrics like probability of assignment and breakeven analysis, which are essential for dynamic sizing strategies such as Adaptive Kelly or risk-targeted scaling. By comparing a trade's assignment probability to your risk budget, you can determine if the potential premium aligns with your position size. The platform also tracks real-time P&L with time decay (Theta), helping you time your exits more effectively.
"Every opportunity is presented as a trade-off, not a direction." - ThetaEdge
When market volatility spikes - such as when the VIX exceeds 25 - ThetaEdge identifies holdings that are particularly sensitive to factors like Vega and Beta. This insight allows you to convert high-risk naked options into defined-risk vertical spreads, helping to cap potential losses. Additionally, Thetix AI provides real-time guidance on selecting the optimal strike or expiration based on current volatility conditions.
Conclusion: Applying Dynamic Position Sizing
Dynamic position sizing revolves around a simple yet powerful idea: adjust your risk based on market volatility, not as a signal to trade but as a way to manage exposure effectively. When volatility spikes - such as when the VIX exceeds 25 or ATR readings surge - your position sizes should shrink to maintain consistent dollar risk. This approach ensures that risk management adapts alongside changing market conditions.
A practical framework involves three tiers: expand your exposure when the VIX is below 15, maintain it between 15 and 25, and scale back when it rises above 25. For individual stocks, rely on the ATR formula discussed earlier to set stop-loss levels that are wide enough to account for normal price fluctuations, while still keeping your overall dollar risk steady across trades.
It’s essential to include safeguards like maximum position caps and drawdown limits, even when volatility metrics suggest increasing your size. These guardrails prevent a cautious position from becoming overly risky if market ranges expand or correlations intensify overnight. By tailoring your exposure to current conditions, you can stabilize your risk profile and transform volatility into a tool that not only protects your capital but also optimizes your strategy during turbulent times. Tools like ThetaEdge can help implement these adjustments by incorporating portfolio-aware risk insights.
The effectiveness of these principles is evident in real-world applications. For example, in October 2025, Alpha Algo Trading Research used a VIX-based dynamic sizing model with an MNQ Breakout Strategy. By adjusting position sizes between 1 and 3 contracts depending on market stress, they boosted their Return-to-Drawdown efficiency by 28%, improving it from 10.84 to 13.85. This demonstrates how dynamic sizing can enhance performance while maintaining disciplined risk control.
FAQs
How do I pick my ATR multiplier?
When selecting your ATR multiplier, think about how you trade and the conditions of the market you're in. Swing traders often go with a multiplier between 1.5 and 2, as it helps filter out market noise while allowing for typical price movements. Ultimately, the "right" multiplier comes down to your comfort with risk, the timeframe you're working with, and how volatile the market is. Starting with the 1.5 to 2 range is a popular choice, but you can tweak it to fit your strategy.
How often should I recalculate my position size?
To stay on top of market changes, it's important to recalculate your position size regularly, especially as market volatility fluctuates. You can do this in real-time or whenever there’s a significant shift in conditions. Adjusting your position size ensures you're managing risk appropriately while aiming to make the most of opportunities in unpredictable markets.
How do I cap total risk across multiple open trades?
To manage overall risk across several trades, incorporate position sizing techniques that align with both market volatility (e.g., the VIX) and your personal risk tolerance. Decide on a maximum percentage of your account balance you're prepared to risk across all trades combined. Then, adjust the size of each trade to fit within that framework. Keep a close eye on your total exposure and make ongoing adjustments to ensure that your cumulative losses remain within the limits you've set.